Analyzing, Monitoring, and Maximizing Electrical Grid Efficiency
The Challenge
The client company had a robust communication server that could query an entire city’s worth of IoT grid-connected devices remotely (such as PV storage batteries, aggregators) and set granular controls and programs to maximize utilization based on factors such as time, temperature, and wattage output. No other product on the market had reached the breadth of coverage and support for this size of a system, however the UI and UX for the system’s existing front-end application was confusing and overly complicated. This presented a problem for the trained engineers and controllers who used this tool daily, a problem that would only magnify when dealing with an initial adoption of upwards of tens of thousands of devices.
Discovering a Solution
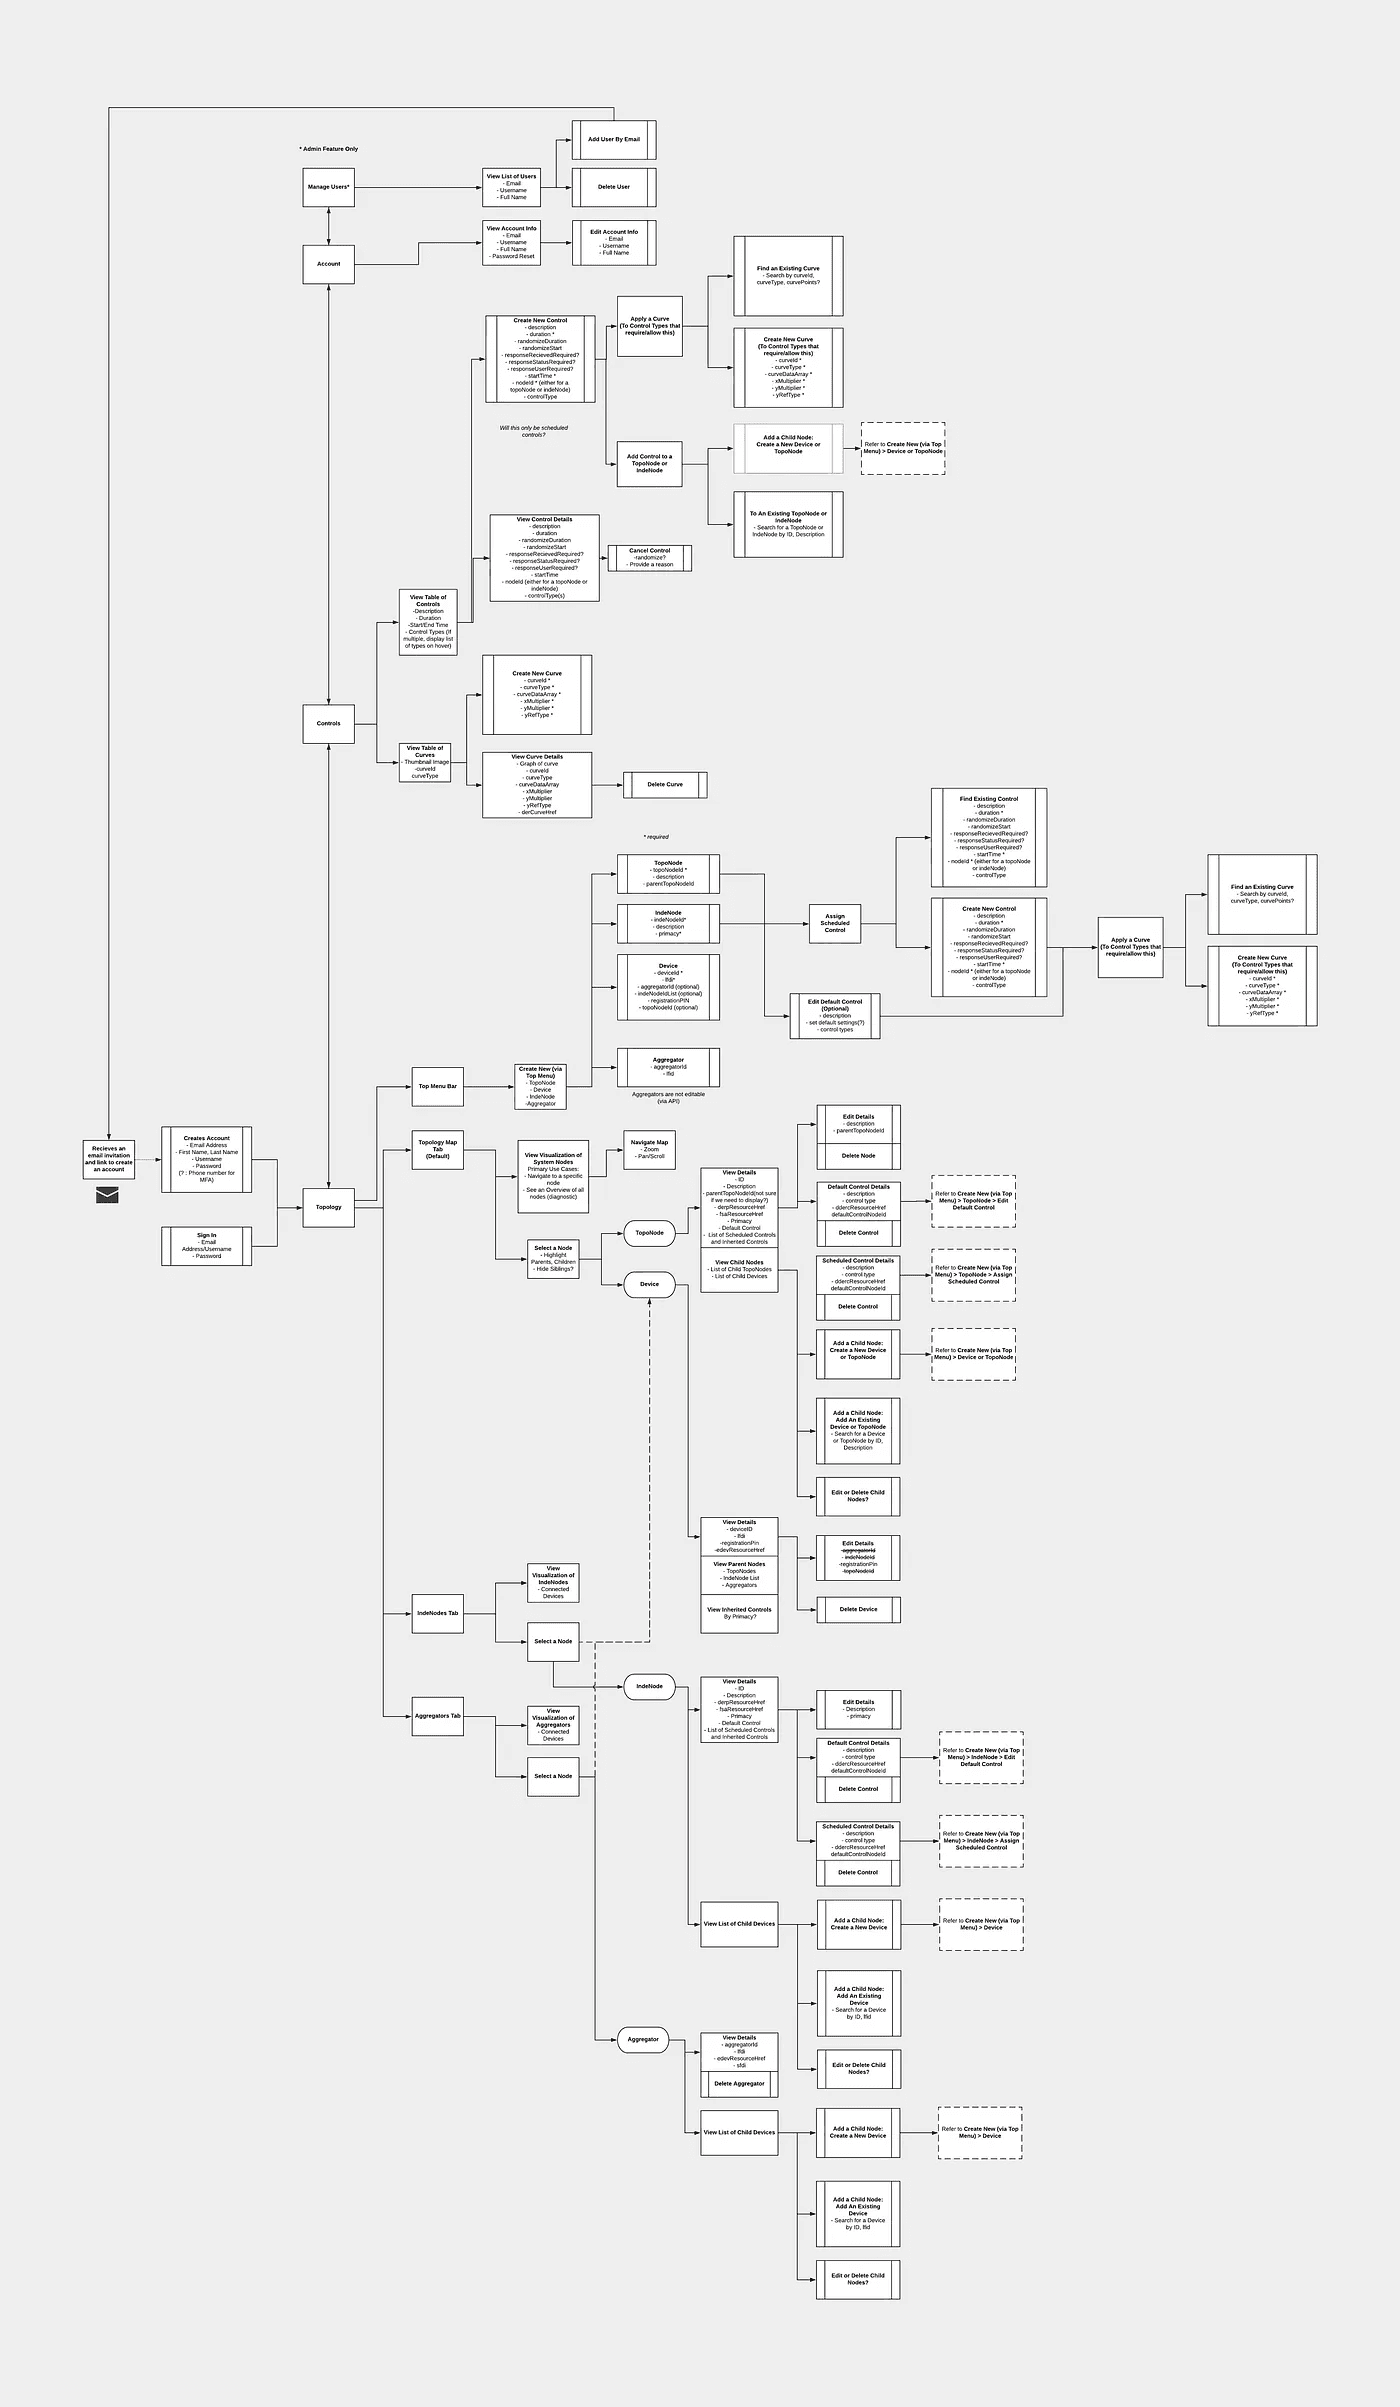
Example user flow with all interactions that needed to be supported by the interface
This was a technical tool with a specific set of users, so the first step was understanding how the engineers used the existing GUI and what the major pain points were. By observing the engineers’ existing workflow and developing a deep understanding of the communication server’s API and every function the GUI had to perform, I could create a high-level user flow and a list of base user requirements.
By understanding the engineers’ workflow it was also possible to identify where the points of highest user-friction occurred. For example, when an underperforming device needed to be identified and remedied, a user would need to manually click through a folder-like tree, digging down through multiple layers of nodes and devices with parent-child relationships until the single device was found. This pattern of needlessly complex workflows to address commonly occurring problems was found throughout the existing GUI.
——
To improve the UX of the application, we had two main points of focus:
Designing an interactive overview of the entire system—showing relationships between devices, and allowing users to quickly identify which controls and settings were most energy efficient and remedy devices with controls and settings that were underperforming.
Simplifying the workflow to create and apply logic-based controls
It was also critical that the GUI designs were optimized for scalability and performance when dealing with a large number of data points.

Sample of designs of improved device management and interactive visualization of device relationships
Designs used a design system that enabled modular component driven designs and allowed flexibility for future iterations and expansions of features.
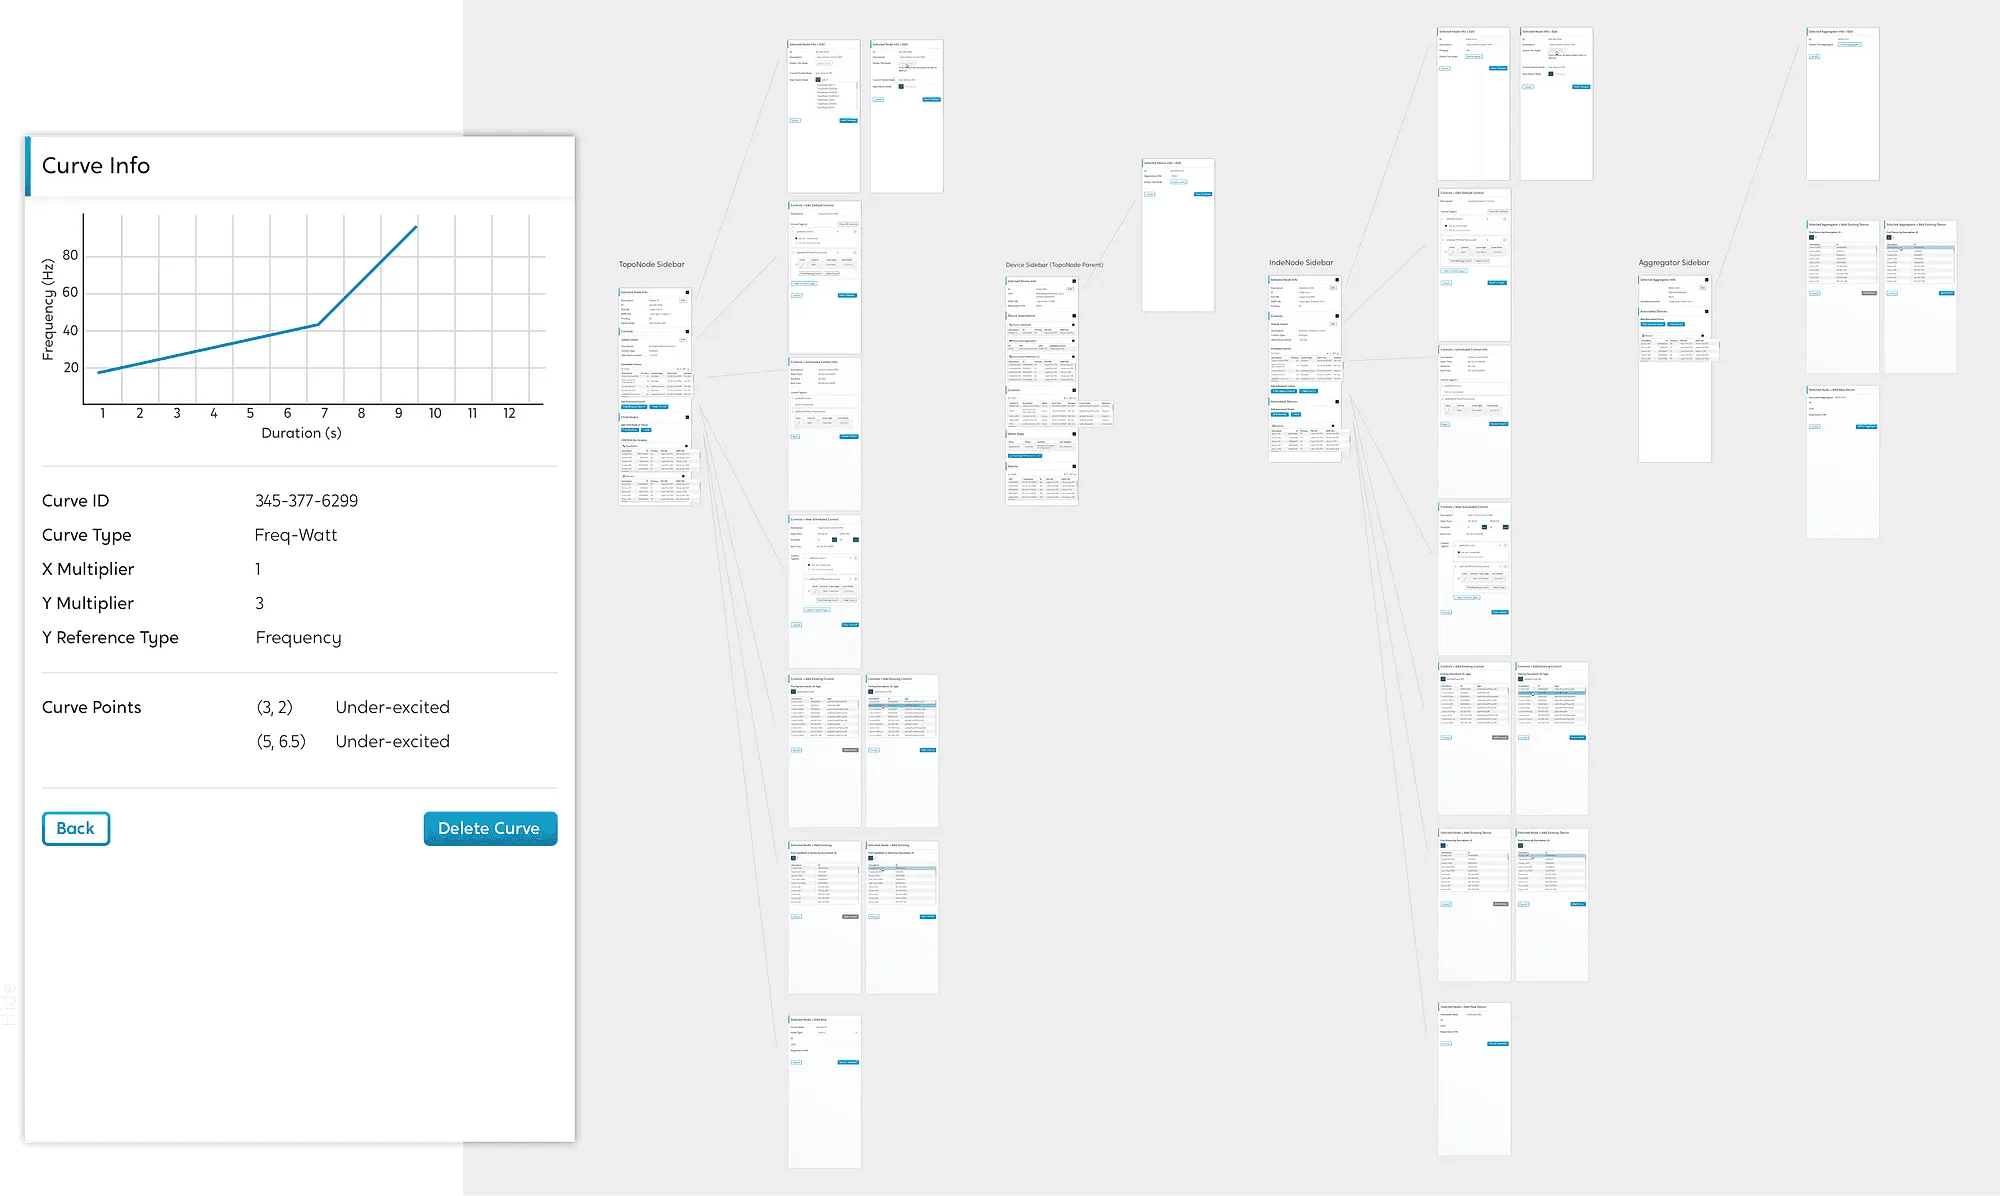
Contextual side panel views to test and program devices and nodes
The Result
The new application was released with success earlier this year, becoming one of the renewable industry’s leading softwares to manage networks of IoT distributed energy resources at scale.